Wind Speed
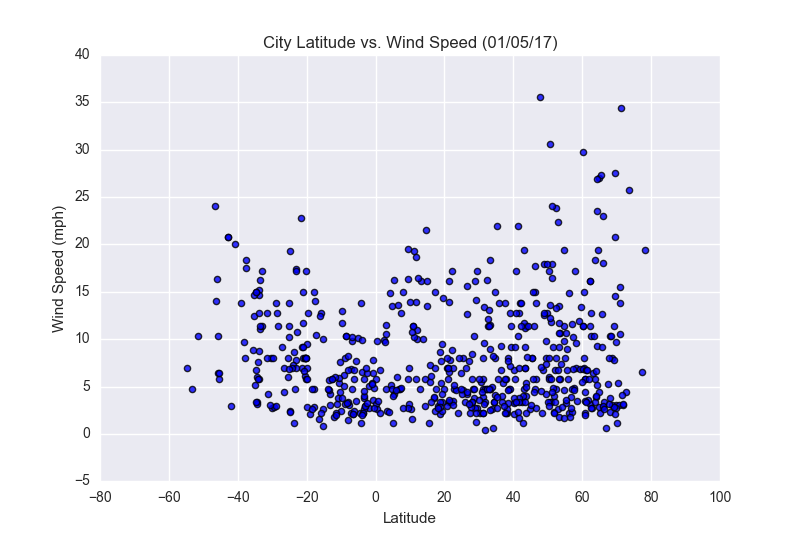
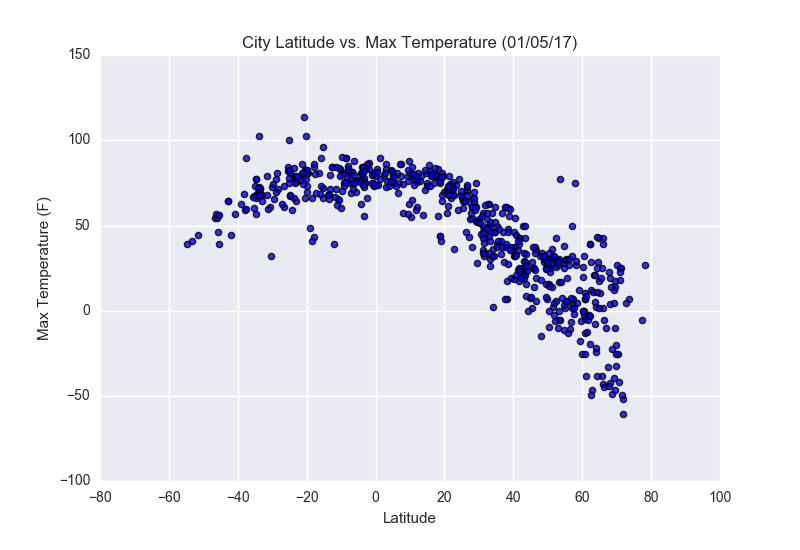
This plot was created from a project that analyzed weather in proximity to the equator by latitude. The data was pulled from the OpenWeatherMap API from the data of 520 cities. The plot above shows a scatterplot of Latitude vs. Windspeed. Windspeed shows the majority of cities in all the latitude ranges are between 0-10 mph wind speed. It also shows us that most of the outliers are in a higher latitude.
Visualizations