Cloudiness
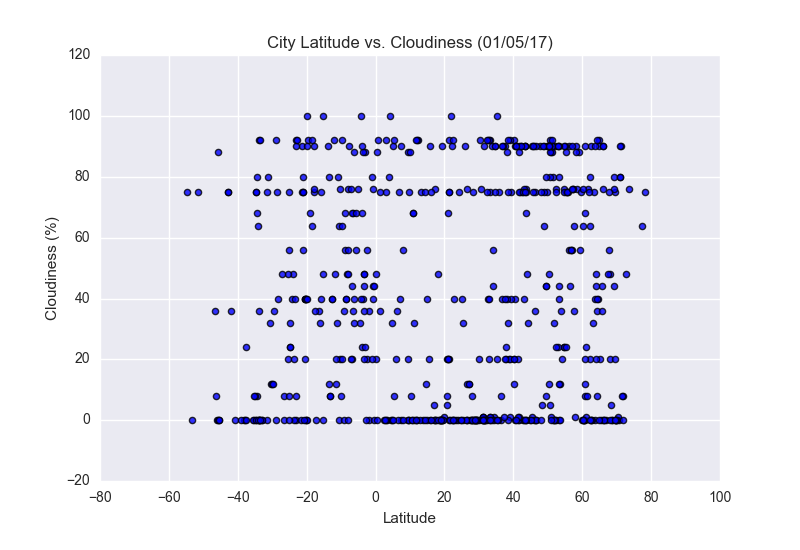
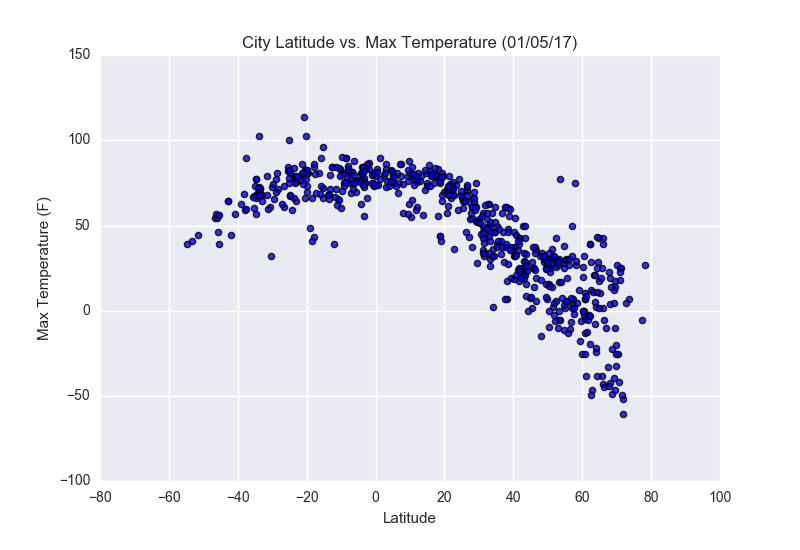
This plot was created from a project that analyzed weather in proximity to the equator by latitude. The data was pulled from the OpenWeatherMap API from the data of 520 cities. The plot above shows a scatterplot of Latitude vs. Cloudiness. This is the plot which shows the least correlation from the four graphs.
Visualizations